angr for real-world use cases
Introduction
The tl;dr of this blog post is that we can easily extend angr to show what’s going on. I’m sharing code snippets for code-coverage visualization in real-time, per-state trace visualization and other niceties like bringing support for debug symbols for Windows targets. The next section is a personal anecdote, feel free to skip it to get to the technical content!
Background story
angr is a project that deeply fascinates me. I tried learning it in 2019. In the same year, I followed Rolf Rolles SMT-Based Binary Program Analysis training which literally unlocked something in my brain:
- The guy made a 40,000 lines of code framework + written material for the training over a period of 2.5 years: this helped me put things into perspective and have a more realistic idea of how much time goes into developing new technology.
- The demos were centered around industry use cases as opposed to CTF problems. It was like learning magic spells you could throw at obfuscated code and make sense of it.
While I did not instantly apply what I learned, seeds were planted, and each year I tried using angr to solve hard problems, giving up each time. Mostly, I was still stuck at the same old problem: why is angr running for so long and eating all my RAM?
At the time, I lacked the skills to properly debug it / ingest its source code. However, years later, I’m not feeling those obstacles anymore. This is probably due to the fact I’ve done way harder and painful things in between, so angr source code would not scare me this time!
Well, fake news. Experimenting with ioctlance in a Windows Driver, I discovered angr was stuck 3 function calls deep after the entry point I gave it. I minimized the test case and asked a colleague (@PickleBryne) for help. We dug at it for 2 hours, and those 2 hours finally helped me overcome the last mental limits I had with angr.
My colleague was quite experienced with angr and insisted on going step by step with the exploration, checking constraints each time with state.solver.constraints. Then, we found that after a call to memmove, that was hooked by a ioctlance SimProcedure, an unsat constraint was added.
My buffer’s address was 0xfffffffff and the Windows driver was doing some kind of overflow check on this address, and did not accept it. Weird! The hook’s implementation looked totally normal to us. It sure didn’t return this rather weird value.
My colleague ran out of helping time budget and I continued by myself for 1 hour, using Pycharm debugger to pinpoint when and why this address appeared. Then I found the culprit:
def store(self, addr, data, size=None, condition=None, **kwargs):
        # Fast path
        if type(addr) is int:
            self._store_one_addr(addr, data, True, addr, condition, size, **kwargs)
            return
        elif not self.state.solver.symbolic(addr):
            self._store_one_addr(self.state.solver.eval(addr), data, True, addr, condition, size, **kwargs)
            return

        if self.state.solver.symbolic(addr) and options.AVOID_MULTIVALUED_WRITES in self.state.options:
            # not completed
            return

        try:
            concrete_addrs = self._interleave_ints(sorted(self.concretize_write_addr(addr)))
        except SimMemoryError:
            if options.CONSERVATIVE_WRITE_STRATEGY in self.state.options:
                return  # not completed
            else:
                raise

        # quick optimization so as to not involve the solver if not necessary
        trivial = len(concrete_addrs) == 1 and (addr == concrete_addrs[0]).is_true()
        if not trivial:
            # apply the concretization results to the state
            constraint_options = [addr == concrete_addr for concrete_addr in concrete_addrs]
            conditional_constraint = self.state.solver.Or(*constraint_options)
            self._add_constraints(conditional_constraint, condition=condition, **kwargs)

            if len(concrete_addrs) == 1:
                # simple case: avoid conditional write since the address has been concretized to one solution
                super().store(concrete_addrs[0], data, size=size, **kwargs)
                return

        for concrete_addr in concrete_addrs:
            # perform each of the stores as conditional
            # the implementation of conditionality must be at the bottom of the stack
            self._store_one_addr(concrete_addr, data, trivial, addr, condition, size, **kwargs)
angr needed a concrete address (read: a real-looking address) to store the result of memmove, but the hook provided an unconstrained symbolic one (read: like x in algebra). This issue is somewhat related:
That’s not a bug, that’s the best angr can do. What do you expect the result of loading from an unconstrained pointer to be? We have to concretize it in order to be able to continue execution. rhelmot
The rhetoric question from rhelmot sounds smart indeed but newbs like me didn’t even think about it before running into the problem.
So the fix was simple, I used the strcpy SimProcedure already available in angr and then it all went very well. I’m telling this anecdote for 2 reasons:
- Persistence is key
- Useful to showcase my workflow when leveraging “blackbox” tools.
angr for real-world use cases
At this point, I was convinced angr‘s problems were fixable with effort and a methodological approach. Duh…but research has a psychological factor and you must believe in yourself to sink even more time and effort when nothing has paid off so far. With this newfound confidence, I was ready to tackle the next steps:
- Understanding what the heck
angris doing. - Finding a solution to “resume”
angr‘s analysis: it takes 5 minutes for it to find my target address, and I dislike waiting 5 minutes each time I run my script. - Learning how to properly use
angrwhen the documentation is not enough.
Let’s tackle the 3rd problem first.
Use Pycharm
Modern IDEs are a must. Honestly I don’t understand those working on big projects with Vim. It’s like coding with your hands tied behind your back. With angr, the documentation does not cover enough information if you’re looking for a specific use case, so you have two (non-exclusive) options:
- Reading the source code
- Playing with the object attributes and see what they contain.
Debugger
With Vim and IPython, you would typically alternate between a bunch of print(obj) and dir(obj). Pycharm shows all of these for you:
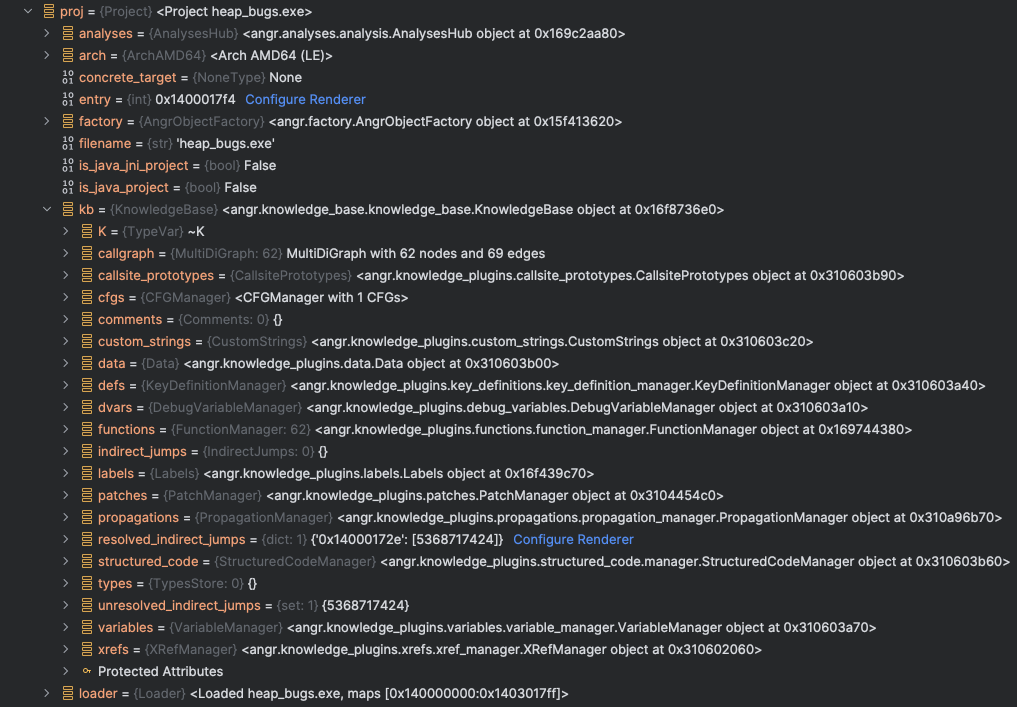
Well it doesn’t show the methods sadly but having this feature is still quite nice.
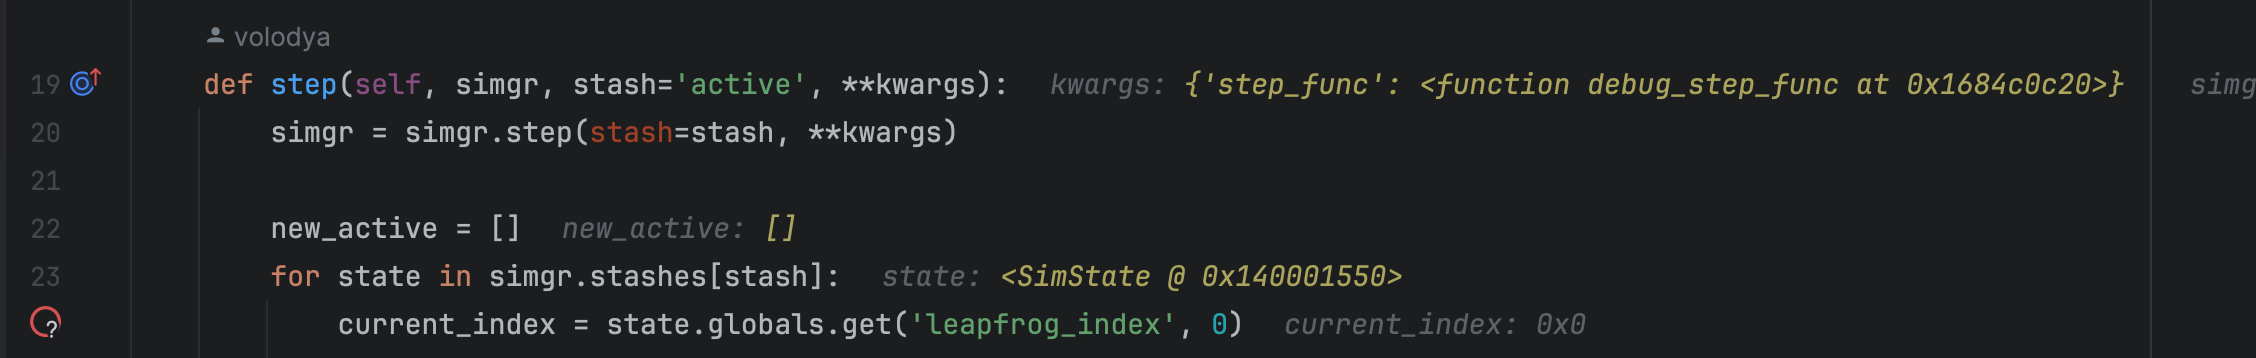
There is also source code annotation available with runtime debug information when the debugger hit a breakpoint:
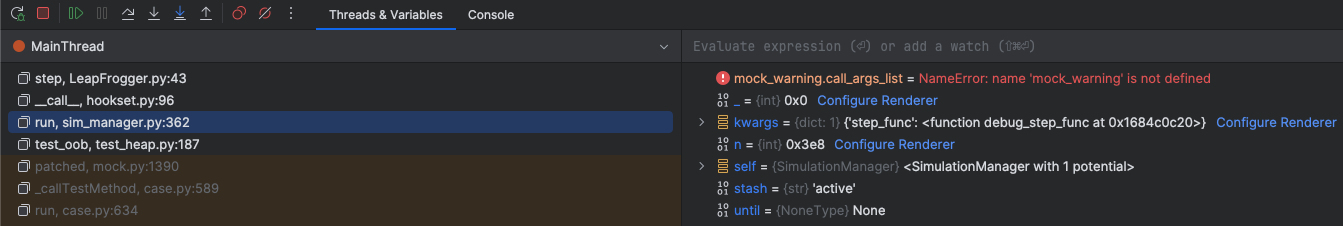
Last but not least, PyCharm allows you to select any frame in the callstack and see the past values of local variables. This can help to find how and when that nasty value appeared for the first time:
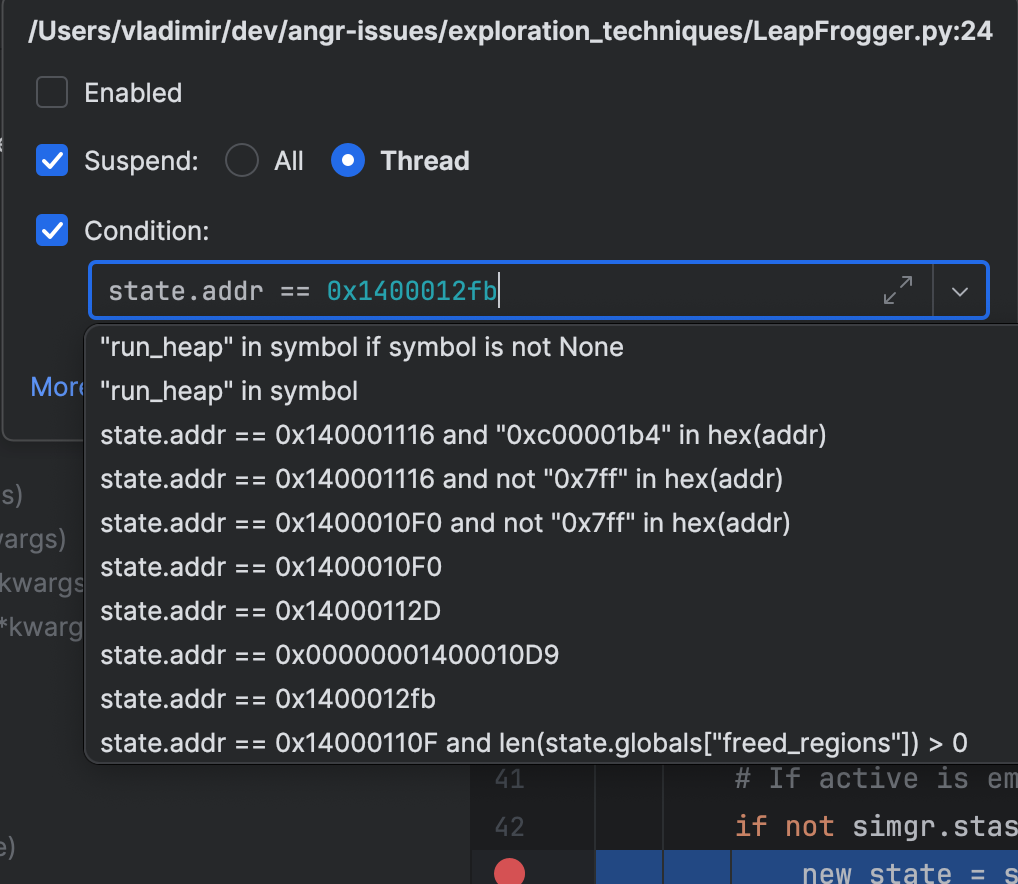
Conditional breakpoints
What if you’re aware that a bug happens only when specific conditions are met, or after many iterations of a loop, or after 5 minutes of execution time? You can of course be really patient and use manual steps and / or print statements, but the right tool for that is conditional breakpoints. Here are real examples of breakpoints I set for a debugging session:
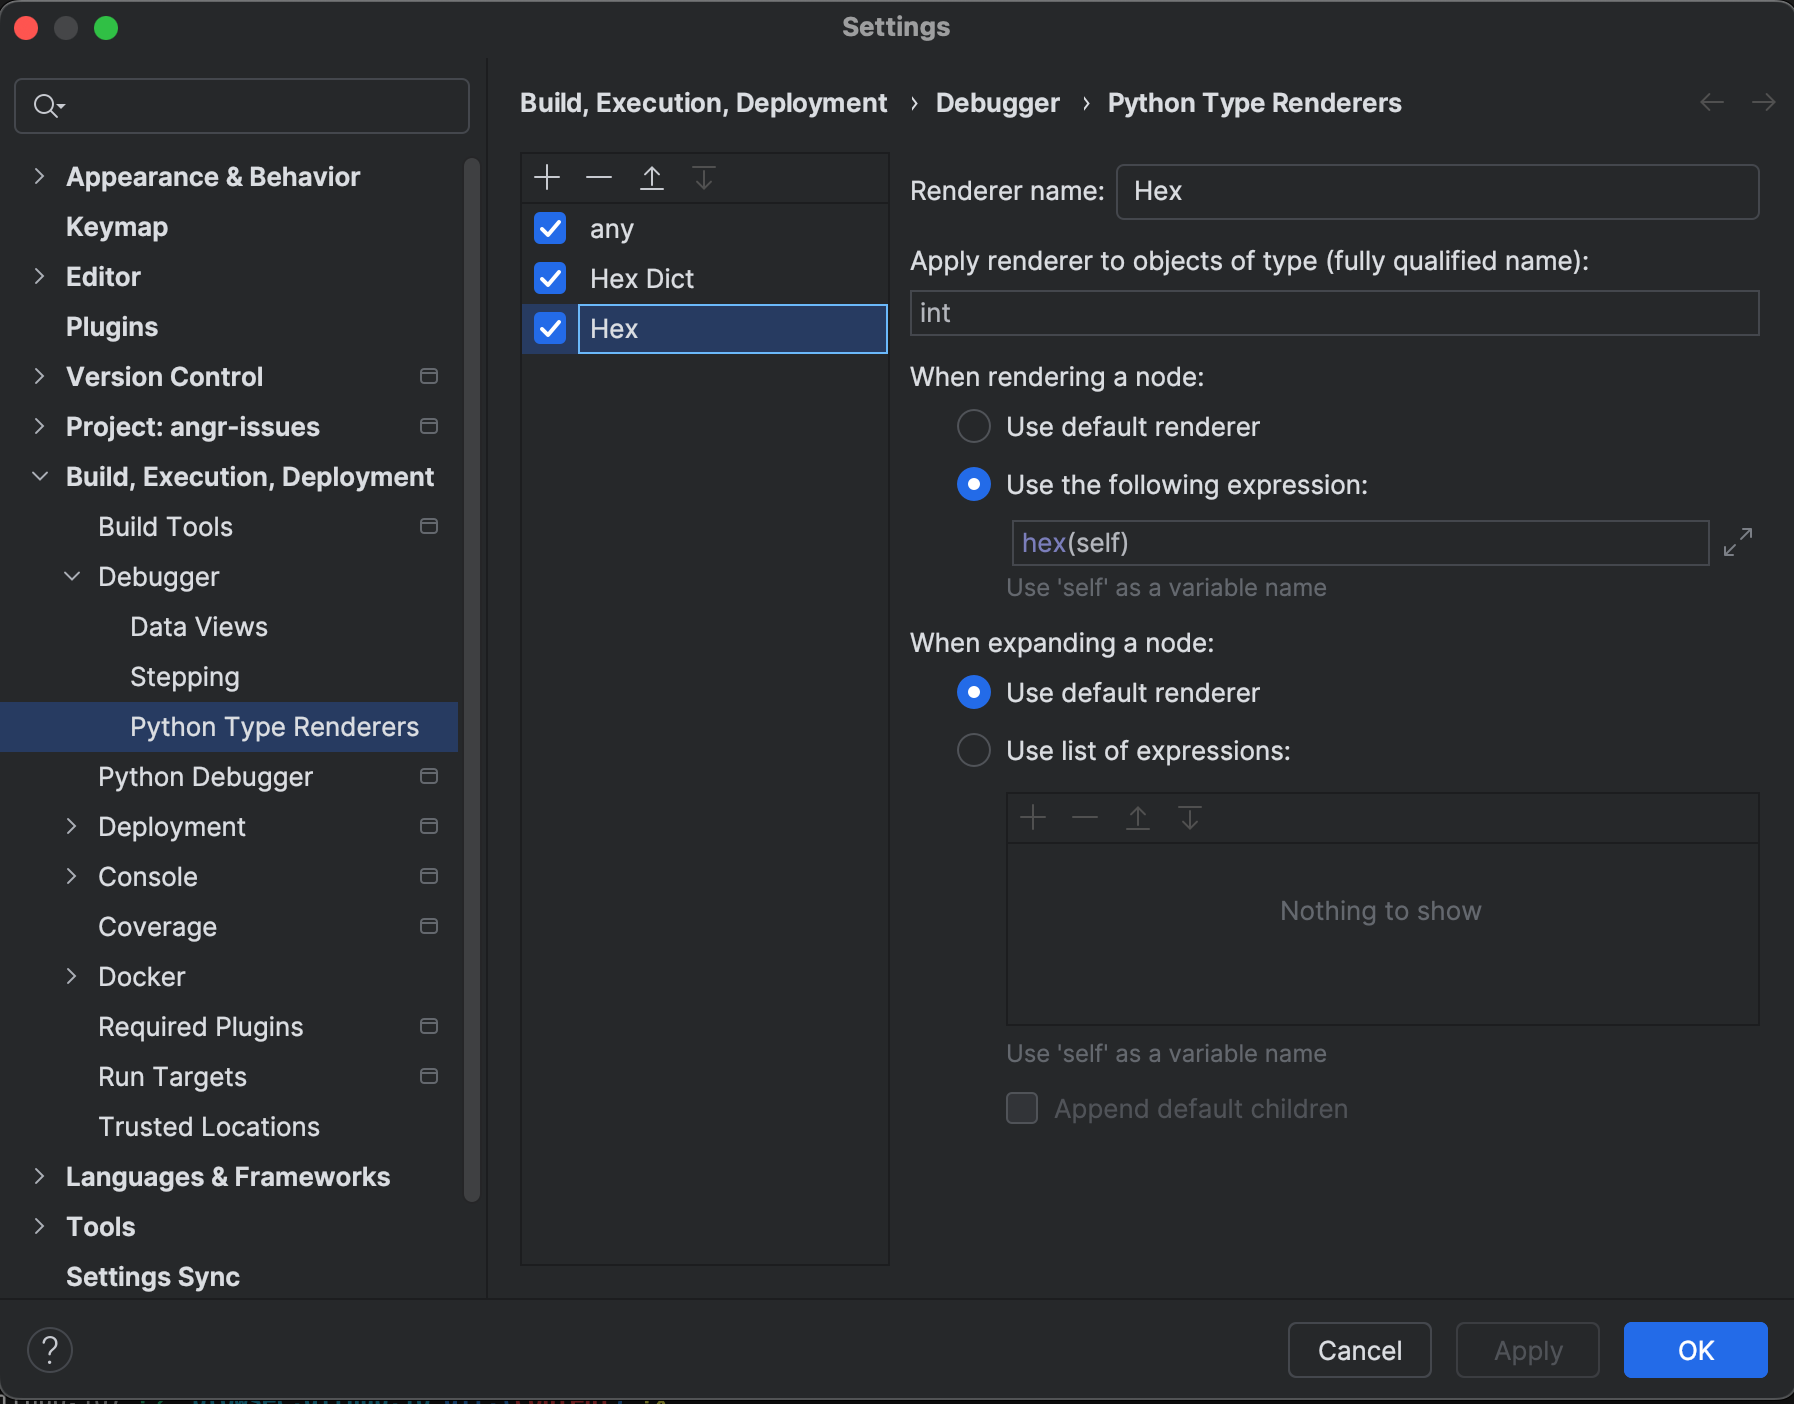
Custom Type Renderer
PyCharm provides a way to customize the way data is shown in the debugger. For angr, I find myself often reading hexadecimal addresses and jumping back and forth between angr and IDA Pro. When PyCharm shows me addresses in base 10, I don’t recognize them anymore and doing print(hex(x)) is only fun the first 10,000 times:
And the same for dict:
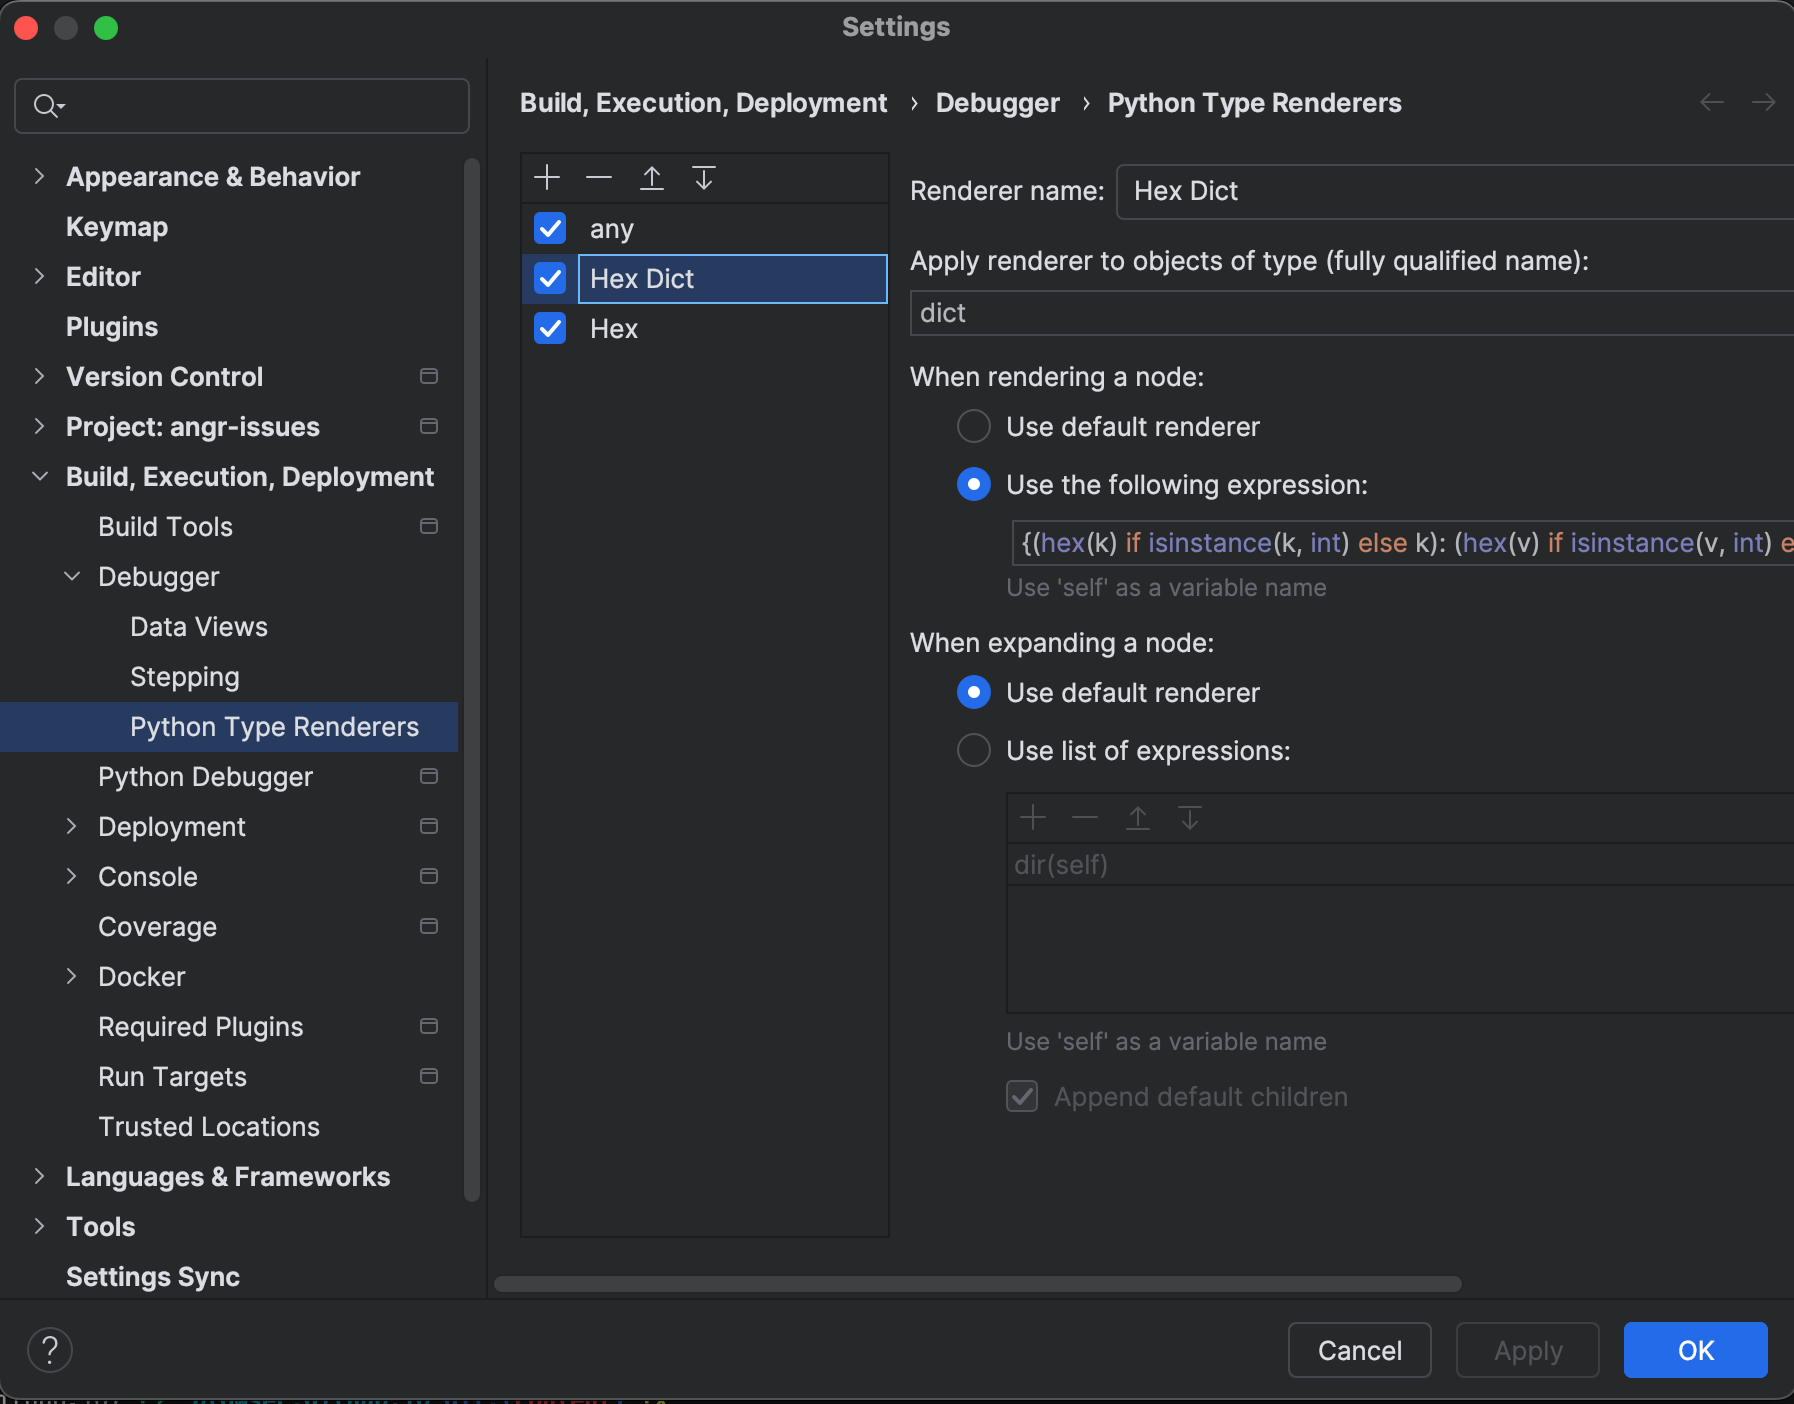
The code in the second screenshot is (thanks Claude 3.5):
{(hex(k) if isinstance(k, int) else k): (hex(v) if isinstance(v, int) else v) for k, v in self.items()}
Using pickle
I’ve known pickle for a while because I used it heavily in my trading bot. Thus, I know how painful it is to make ALL your classes serializable, and assumed angr was too complex to be pickle-able. I was wrong!
From the documentation:
How do I serialize angr objects? Pickle will work. However, Python will default to using an extremely old pickle protocol that does not support more complex Python data structures, so you must specify a more advanced data stream format. The easiest way to do this is
pickle.dumps(obj, -1).
What this means is you can pickle the following things:
angr.Projectangr.analyses.CFGEmulated- The Simulation Manager after a succesful but time consuming
.explorecall!
By doing this, you can resume your angr script and thus iterate rapidly on the trial-error process that, in my opinion, is primordial to both learn and build something new.
Introspection
Let’s get to the core of this article. With any long-running job, we, developers, require confidence that the executed program is working as intended and not wasting CPU cycles because of a problem. How to diagnose those? Well, recently I’m fond of the logging anti-pattern: I log everything to a file so that I can, at a glance, understand if something went sideways.
But here we can go further than this.
Coverage: basic attempt
In fuzzing, we can use code coverage and lighthouse to visualize the fuzzer’s exploration (and maybe identify bottlenecks). Can we do that with angr?
Sure, as shown by Jannis Kirschner at Insomni’hack 2022:
def get_small_coverage(*args, **kwargs):
    sm = args[0]
    stashes = sm.stashes
    i = 0
    for simstate in stashes["active"]:
        state_history = ""

        for addr in simstate.history.bbl_addrs.hardcopy:
            write_address = hex(addr)
            state_history += "{0}\n".format(write_address)
        raw_syminput = simstate.posix.stdin.load(0, state.posix.stdin.size)

        syminput = simstate.solver.eval(raw_syminput, cast_to=bytes)
        print(syminput)
        ip = hex(state.solver.eval(simstate.ip))
        uid = str(uuid.uuid4())
        sid = str(i).zfill(5)
        filename = "{0}_active_{1}_{2}_{3}".format(sid, syminput, ip, uid)

        with open(filename, "w") as f:
            f.write(state_history)
        i += 1

simgr.explore(find=0x00001407, step_func=get_small_coverage)
Here, I used ChatGPT as an OCR tool to transcribe the slide shown in the YouTube Video (I know ChatGPT uses pytesseract behind the scenes, but the output is a lot better).
Running this step_func creates a bunch of files in the local folder as angr progresses towards the goal given to it:
$ ls -lsaht | head
total 74912
 0 drwxr-xr-x    38 user  staff   1.2K Jun 14 14:34 ..
 0 drwxr-xr-x  5416 user  staff   169K Jun 13 15:35 .
16 -rw-r--r--     1 user  staff   7.9K Jun  6 16:13 00164_active_0x1c0010ae4_d9d59da2-daf1-43b3-999a-02d85f814778
16 -rw-r--r--     1 user  staff   7.9K Jun  6 16:13 00163_active_0x1c0010ae6_b9618c9b-6c05-4c2d-8ba1-6a9b74dbdcb5
16 -rw-r--r--     1 user  staff   7.9K Jun  6 16:13 00162_active_0x1c0010b98_81b30e77-01ad-43c0-8990-c58877d738d2
16 -rw-r--r--     1 user  staff   7.9K Jun  6 16:13 00161_active_0x1c0010b9d_18a2bf38-1aa1-47c5-a206-2cc116ab5486
16 -rw-r--r--     1 user  staff   7.9K Jun  6 16:13 00160_active_0x1c0010baf_788b6aae-a9f2-4866-9458-7c28c0bf3390
16 -rw-r--r--     1 user  staff   7.9K Jun  6 16:13 00159_active_0x1c0010bb7_96548594-619a-4a2e-8445-072c208ec02a
16 -rw-r--r--     1 user  staff   7.9K Jun  6 16:13 00158_active_0x1c01000e0_f1177956-e9e4-4c8f-8ab3-a87e4c9821a9
And reading one of these shows:
$ cat 00164_active_0x1c0010ae4_d9d59da2-daf1-43b3-999a-02d85f814778 | head
0x1c00109e8
0x1c0010a1b
0x1c0010a36
0x1c0010b4c
0x1c0010b88
0x1c002fc30
0x1c0100298
0x1c002fc3b
0x1c0010b8d
0x1c0010b5f
Then we can load all these files using Lighthouse: IDA Pro > Load File > Code Coverage batch:
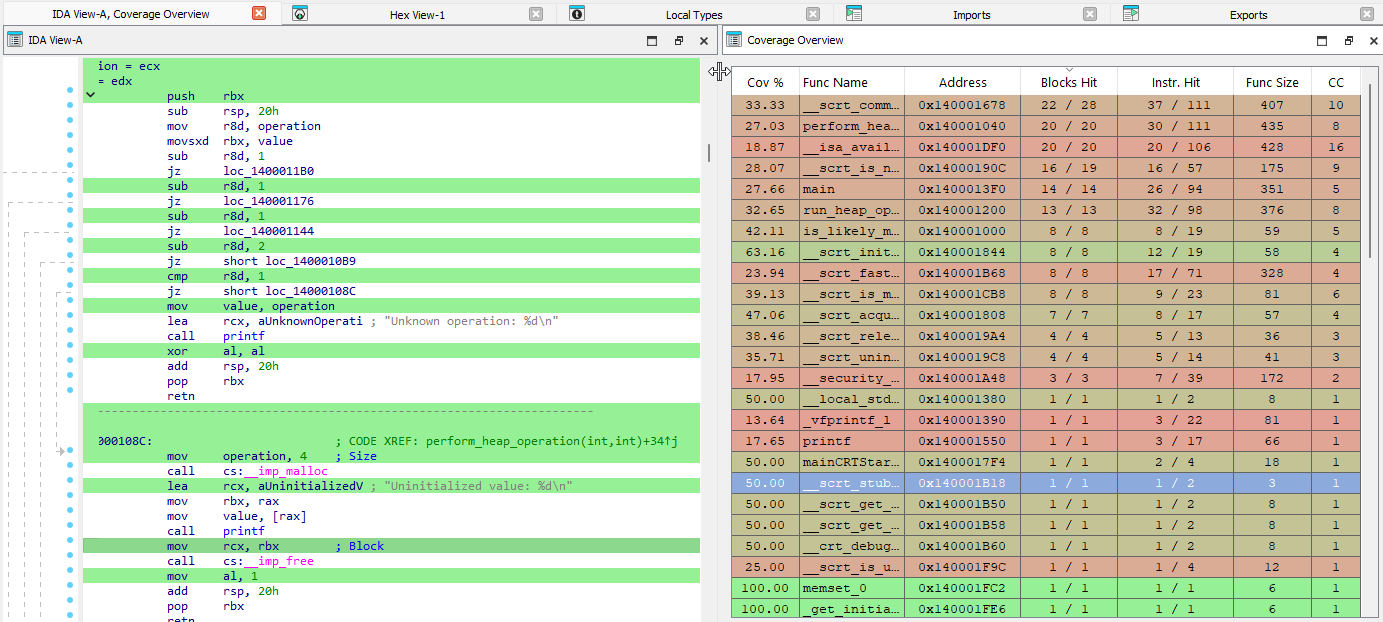
This is quite nice!
Callstack
Another useful tool in our toolbox is the ability to know where angr currently is and how it got there. The documentation states that we should use state.history.descriptions.hardcopy and state.history.events. Let’s try those:
f = simgr.one_found
pprint.pprint(f.history.descriptions.hardcopy)
['<IRSB from 0x140001200: 1 sat>',
 '<SimProcedure HookVPrintf from 0x140001550: 1 sat>',
 '<IRSB from 0x140001238: 2 sat>',
 '<IRSB from 0x1400012f8: 1 sat>',
 '<SimProcedure HookVPrintf from 0x140001550: 1 sat>',
 '<IRSB from 0x140001304: 1 sat>',
 '<IRSB from 0x140001040: 1 sat 1 unsat>',
 '<IRSB from 0x1400011b0: 1 sat 1 unsat>',
 '<IRSB from 0x1400011b9: 1 sat>',
 '<SimProcedure MallocHook from 0x140100050: 1 sat>',
 '<IRSB from 0x1400011c2: 1 sat>',
 '<SimProcedure HookVPrintf from 0x140001550: 1 sat>',
 '<IRSB from 0x1400011e5: 1 sat>',
 '<IRSB from 0x140001311: 1 sat>',
 '<IRSB from 0x140001040: 1 sat 1 unsat>',
 '<IRSB from 0x140001056: 1 sat 1 unsat>',
 '<IRSB from 0x14000112d: 1 sat>',
 '<SimProcedure HookVPrintf from 0x140001550: 1 sat>',
 '<IRSB from 0x14000113c: 1 sat>',
 '<IRSB from 0x14000131b: 1 sat>',
 '<IRSB from 0x140001000: 1 sat 1 unsat>',
 '<IRSB from 0x140001034: 1 sat>',
 '<IRSB from 0x14000132c: 1 sat 1 unsat>',
 '<IRSB from 0x14000133a: 1 sat 1 unsat>']
f.history.events
Out[3]: <angr.state_plugins.history.LambdaIterIter at 0x310f73350>
list(f.history.events)
Out[4]:
[<SimActionConstraint 0x140001200:0 <SAO <Bool operations_2419_96[95:64] >= 0x0>>>,
 <SimActionConstraint 0x140001200:0 <SAO <Bool operations_2419_96[95:64] <= 0x7a6b>>>,
 <SimActionConstraint 0x140001200:0 <SAO <Bool operations_2419_96[63:32] >= 0x0>>>,
 <SimActionConstraint 0x140001200:0 <SAO <Bool operations_2419_96[63:32] <= 0x7a6b>>>,
 <SimActionConstraint 0x140001200:0 <SAO <Bool operations_2419_96[31:0] >= 0x0>>>,
 <SimActionConstraint 0x140001200:0 <SAO <Bool operations_2419_96[31:0] <= 0x7a6b>>>,
 <SimActionConstraint 0x140001200:0 <SAO <Bool values_2420_96[95:64] >= 0x0>>>,
 <SimActionConstraint 0x140001200:0 <SAO <Bool values_2420_96[95:64] <= 0x9>>>,
 <SimActionConstraint 0x140001200:0 <SAO <Bool values_2420_96[63:32] >= 0x0>>>,
 <SimActionConstraint 0x140001200:0 <SAO <Bool values_2420_96[63:32] <= 0x9>>>,
 <SimActionConstraint 0x140001200:0 <SAO <Bool values_2420_96[31:0] >= 0x0>>>,
 <SimActionConstraint 0x140001200:0 <SAO <Bool values_2420_96[31:0] <= 0x9>>>,
 <SimActionConstraint 0x140001200:0 <SAO <Bool operations_2419_96[95:64] == 0x7a6b>>>,
 <SimEvent unconstrained 11890, with fields name, bits>,
 <SimEvent unconstrained 11891, with fields name, bits>,
 <SimEvent unconstrained 11892, with fields name, bits>,
 <SimEvent unconstrained 11893, with fields name, bits>,
 <SimEvent unconstrained 11894, with fields name, bits>,
 <SimEvent unconstrained 11895, with fields name, bits>,
 <SimEvent unconstrained 11896, with fields name, bits>,
 <SimEvent fs_write 11897, with fields filename, data, size, pos>,
 <SimActionConstraint 0x14000123f:23 <SAO <Bool mem_100000_2428_32{UNINITIALIZED} != 0x7a69>>>,
 <SimActionConstraint 0x140001289:18 <SAO <Bool mem_100000_2428_32{UNINITIALIZED} != 0x7a6a>>>,
 <SimActionConstraint 0x1400012f6:18 <SAO <Bool mem_100000_2428_32{UNINITIALIZED} == 0x7a6b>>>,
 <SimEvent fs_write 11906, with fields filename, data, size, pos>,
 <SimEvent unconstrained 11933, with fields name, bits>,
 <SimEvent unconstrained 11934, with fields name, bits>,
 <SimEvent fs_write 11935, with fields filename, data, size, pos>,
 <SimEvent unconstrained 11938, with fields name, bits>,
 <SimEvent unconstrained 11967, with fields name, bits>,
 <SimEvent fs_write 11968, with fields filename, data, size, pos>,
 <SimActionConstraint 0x140001007:22 <SAO <Bool mem_100000_2428_32{UNINITIALIZED} != 0x1>>>]
Okay, there is a lot of information in there, but I find it hard to read and we’re losing an important information because the callstack is “flattened” (probably not the right word but I’m going with it).
Given these shortcomings, I implemented a simple function that prints some kind of annotated backtrace for an angr state, using indentation to display the control flow:
def pretty_print_callstack(state: angr.SimState, max_depth: int = 10) -> None:
    """
    Print a formatted call stack for a given state.

    Args:
        state: The simulation state.
        max_depth: Maximum depth of the call stack to print.
    """
    state_history: str = "Call Stack:\n"
    kb_functions = shared.proj.kb.functions

    last_addr: int = 0
    repeat_count: int = 0
    formatted_lines: List[str] = []
    call_stack: List[angr.knowledge_plugins.functions.function.Function] = []
    current_func: angr.knowledge_plugins.functions.function.Function | None = None

    for i, addr in enumerate(state.history.bbl_addrs.hardcopy):
        func: angr.knowledge_plugins.functions.function.Function = kb_functions.floor_func(addr)

        if addr == last_addr:
            repeat_count += 1
        else:
            if repeat_count > 0:
                formatted_lines[-1] += f" (repeated {repeat_count + 1} times)"
                repeat_count = 0

            if func != current_func:
                if func in call_stack:
                    while call_stack and call_stack[-1] != func:
                        call_stack.pop()
                    if call_stack:
                        call_stack.pop()
                else:
                    call_stack.append(func)
                current_func = func

            indent: str = ' ' * (len(call_stack) * 2)
            if func:
                fname: str = func.human_str if hasattr(func, 'human_str') else func.name
                func_prototype: str = func.prototype if hasattr(func, 'prototype') else ""
                formatted_lines.append(
                    f"{indent}-> 0x{addr:x} : {fname} {func_prototype} ({len(list(func.xrefs))} xrefs)")
            else:
                formatted_lines.append(f"{indent}-> 0x{addr:x} : Unknown function")

        last_addr = addr

    if repeat_count > 0:
        formatted_lines[-1] += f" (repeated {repeat_count + 1} times)"

    state_history += "\n".join(formatted_lines)

    if len(formatted_lines) > max_depth + 3:
        logger.debug("\n".join([state_history.split("\n")[0]] + formatted_lines[:max_depth]))
        logger.debug(f"...(truncated {len(formatted_lines) - (max_depth + 3)} lines)")
        logger.debug("\n".join(formatted_lines[-3:]))
    else:
        logger.debug(state_history)
This displays:
Active state: <SimState @ 0x1400010f0>
2024-06-30 13:39:57 | DEBUG | [introspection.py:113] pretty_print_callstack() | Call Stack:
  -> 0x140001200 : sub_140001200 None (0 xrefs)
    -> 0x140001550 : sub_140001550 None (0 xrefs)
-> 0x140001238 : sub_140001200 None (0 xrefs)
-> 0x140001284 : sub_140001200 None (0 xrefs)
-> 0x1400012f1 : sub_140001200 None (0 xrefs)
-> 0x1400012f8 : sub_140001200 None (0 xrefs)
  -> 0x140001550 : sub_140001550 None (0 xrefs)
    -> 0x140001304 : sub_140001200 None (0 xrefs)
      -> 0x140001040 : sub_140001040 (long long (64 bits), long long (64 bits)) -> void (0 xrefs)
      -> 0x1400011b0 : sub_140001040 (long long (64 bits), long long (64 bits)) -> void (0 xrefs)
      -> 0x1400011b9 : sub_140001040 (long long (64 bits), long long (64 bits)) -> void (0 xrefs)
        -> 0x140100050 : malloc (unsigned long (64 bits)) -> void* (0 xrefs)
    -> 0x1400011c2 : sub_140001040 (long long (64 bits), long long (64 bits)) -> void (0 xrefs)
-> 0x140001550 : sub_140001550 None (0 xrefs)
  -> 0x1400011e5 : sub_140001040 (long long (64 bits), long long (64 bits)) -> void (0 xrefs)
    -> 0x140001311 : sub_140001200 None (0 xrefs)
-> 0x140001040 : sub_140001040 (long long (64 bits), long long (64 bits)) -> void (0 xrefs)
-> 0x140001056 : sub_140001040 (long long (64 bits), long long (64 bits)) -> void (0 xrefs)
-> 0x140001060 : sub_140001040 (long long (64 bits), long long (64 bits)) -> void (0 xrefs)
-> 0x14000106a : sub_140001040 (long long (64 bits), long long (64 bits)) -> void (0 xrefs)
-> 0x1400010b9 : sub_140001040 (long long (64 bits), long long (64 bits)) -> void (0 xrefs)
-> 0x1400010c5 : sub_140001040 (long long (64 bits), long long (64 bits)) -> void (0 xrefs)
-> 0x1400010d9 : sub_140001040 (long long (64 bits), long long (64 bits)) -> void (0 xrefs)
-> 0x1400010f0 : sub_140001040 (long long (64 bits), long long (64 bits)) -> void (0 xrefs) (repeated 97 times)
Notice the last line: repeated 97 times. angr was exploring a loop with 100 iterations. Can be useful to diagnose state explosion!
For now, the callstack lacks some symbols. Unfortunately, angr doesn’t yet support Windows symbols. Let’s remedy that.
Windows Debugging Symbols
Windows debugging symbols are available in the form of *.pdb files that live alongside the compiled binary.
Downloading symbols
On Windows platforms, symchk.exe would typically be used to download symbols. However it would be a bit sad to add this kind of dependencies, so let’s reimplement it. If you’ve ever wondered how symchk.exe works, it basically just does a HTTP request to this URL:
https://msdl.microsoft.com/download/symbols/{pdbname}/{signature}/{pdbname}
- pdbname: the name of the PDB file. Surprisingly, it’s not always the same name as the PE file (it’s
ntkrnlmp.pdbforntoskrnl.exe). You can get it from the fieldPdbFileNameby walking theDIRECTORY_ENTRY_DEBUGentries in the PE file. - guid: you can get it from the same
DIRECTORY_ENTRY_DEBUGentry:Signature_String.
Because pefile is already in angr‘s dependencies, let’s reuse it.
def download_pdb(self, download_dir: str = ".") -> None:
    """
    Download the PDB file for the current binary.

    Args:
        download_dir (str): Directory to save the downloaded PDB.
    """
    pdbname, signature = self.get_pdb_info(self.proj.filename)

    if self.is_pdb_stored_locally(download_dir, pdbname):
        logger.info(f"PDB already exists locally for {self.proj.filename}")
        return

    download_url = f"https://msdl.microsoft.com/download/symbols/{pdbname}/{signature.upper()}/{pdbname}"
    logger.info(f"Downloading PDB from: {download_url}")

    r = requests.head(
        download_url,
        headers={"User-Agent": "Microsoft-Symbol-Server/10.0.10036.206"},
        allow_redirects=True
    )

    if r.status_code == 200:
        target_file = os.path.join(download_dir, pdbname)
        with requests.get(r.url, headers={"User-Agent": "Microsoft-Symbol-Server/10.0.10036.206"},
                            stream=True) as pdb:
            pdb.raise_for_status()
            with open(target_file, "wb") as f:
                for chunk in pdb.iter_content(chunk_size=8192):
                    f.write(chunk)
        logger.info(f"PDB downloaded to: {target_file}")
        self.pdb_path = target_file
    else:
        logger.error(f"(HTTP {r.status_code}) Could not find PDB at {download_url}")

@staticmethod
def get_pdb_info(binary_path: str) -> Tuple[str, str]:
    """
    Extract PDB name and signature from a PE file.

    Args:
        binary_path (str): Path to the PE file.

    Returns:
        Tuple[str, str]: A tuple containing the PDB name and signature.
    """
    pe_obj = pefile.PE(binary_path, fast_load=True)
    pe_obj.parse_data_directories([pefile.DIRECTORY_ENTRY['IMAGE_DIRECTORY_ENTRY_DEBUG']])

    for debug_entry in pe_obj.DIRECTORY_ENTRY_DEBUG:
        if hasattr(debug_entry.entry, 'PdbFileName'):
            pdb_filename = debug_entry.entry.PdbFileName.decode('utf-8').rstrip('\x00')
            guid = debug_entry.entry.Signature_String

            # Use only the filename if a full path is given
            pdb_filename = os.path.basename(pdb_filename)

            return pdb_filename, guid

    raise ValueError("No PDB debug information found in the PE file")

@staticmethod
def is_pdb_stored_locally(directory: str, filename: str) -> bool:
    """Check if the PDB file already exists locally."""
    return os.path.exists(os.path.join(directory, filename))
Notice that User-Agent header we’re sending? Microsoft-Symbol-Server/10.0.10036.206. That’s us pretending to be a legit symbol server client. Sometimes, you gotta play dress-up to get what you want!
So, in a nutshell, this code does the following:
- Check if we’ve already got this PDB lounging around locally.
- Use
pefileto extract the PDB information. - Build the URL.
- Check if Microsoft’s servers like our request (HTTP 200).
- Download the file. Next time we need it, it’ll be right there waiting for us.
- If something goes wrong - like the PDB isn’t where we expected it to be - we log an error. Because, you know, stuff happens.
And that’s pretty much it. We’ve just sweet-talked Microsoft’s servers into giving us debug symbols. But before you can go forth and debug like a boss, you must parse it and populate angr‘s kb with the new names.
Demangling
Symbols in the PDB file are usually mangled. The well known cxxfilt library did not work for me, but I discovered one made by the Antivirus vendor AVG. Despite the last commit being made 7 years ago, the library works out-of-the-box.
Updating angr’s knowledge base
When it comes to Python libraries that know how to parse PDB files, we don’t have much choices. I decided to use pdbparse, which is old and buggy. Examples online did not work for me, so using pycharm's debugger I manually explored all the attributes of a parsed PDB file and put together the following code:
def load_global_symbols(self) -> Dict[int, str]:
    """
    Load global symbols from the PDB.

    Returns:
        Dict[int, str]: A dictionary mapping offsets to symbol names.
    """
    globals_symbols = {}
    for stream in self.pdb.streams:
        if hasattr(stream, 'funcs'):
            for sym, sym_value in stream.funcs.items():
                globals_symbols[sym_value.offset] = sym_value.name
                logger.debug(f"Global symbol: {sym_value.name} at {hex(sym_value.offset)}")
    return globals_symbols
Notice I’m using the offset attribute. This is a Relative Virtual Address (RVA) and can’t be used as-is with angr. We have to adjust it first. For Windows binaries, angr seems to give the address loaded base + offset to all functions. The offsets in the PDB are however offsets to their enclosing PE section. Knowing that, let’s put together the following code:
def get_text_section_offset(self) -> int:
    """
    Get the offset of the .text section from the image base.

    Returns:
        int: The offset of the .text section, or 0 if not found.
    """
    main_object = self.proj.loader.main_object
    for section_name, section in main_object.sections_map.items():
        if section_name.startswith('.text'):
            return section.vaddr - main_object.mapped_base

    logger.warning("Could not find .text section. Using 0 as offset.")
    return 0

def address_to_symbol(self, address: int) -> Optional[str]:
    """
    Convert an address to a symbol name.

    Args:
        address (int): The address to look up.

    Returns:
        Optional[str]: The symbol name if found, None otherwise.
    """
    rva: int = address - self.proj.loader.main_object.mapped_base

    adjusted_rva: int = rva - self.text_section_offset
    symbol: Optional[str] = self.symbols.get(adjusted_rva)
    if symbol:
        return symbol

    logger.warning(f"Symbol not found for address {hex(address)} (RVA: {hex(rva)}, Adjusted RVA: {hex(adjusted_rva)})")
    return None
This uses loader.main_object.mapped_base and the .text section offset to adjust all offsets. Note that we assume every symbol will be in the .text section, which is obviously not true, but I don’t code to make art, I code to solve just enough of the problems I’m facing.
Then, we can update angr‘s knowledge base with this information:
    def update_kb_with_symbols(self):
        """
        Update the knowledge base with symbols.

        This method updates the names of functions in the angr knowledge base
        with demangled symbols from the PDB.
        """
        for func in self.proj.kb.functions.values():
            symbol = self.address_to_symbol(func.addr)
            if symbol:
                demangled = self.demangle_name(symbol)
                func.name = demangled
                logger.debug(f"Function {hex(func.addr)} updated with symbol: {func.name}")
The entire file is:
import os
import re
import requests
from typing import Dict, Optional, Tuple

import angr
import pdbparse
import pefile
from cppmangle import demangle, cdecl_sym

from helpers.log import logger


class SymbolManager:
    """
    A class to manage symbols for an angr project.

    This class handles loading symbols from PDB files, demangling names,
    mapping addresses to symbols, and downloading PDB files if necessary.
    """

    def __init__(self, proj: angr.Project):
        """
        Initialize the SymbolManager.

        Args:
            proj (angr.Project): The angr project to analyze.
        """
        self.proj: angr.Project = proj
        self.pdb: Optional[pdbparse.PDB] = None
        self.symbols: Dict[int, str] = {}
        self.text_section_offset: int = 0

        self.load_symbols()
        self.load_global_symbols()
        self.get_text_section_offset()
        self.pdb_path = ""

    def load_symbols(self, download_dir: str = ".") -> None:
        """
        Load symbols for the angr project from a PDB file.

        If the PDB file doesn't exist, it attempts to download it.
        """
        binary_path: str = self.proj.filename
        pdb_path, _ = self.get_pdb_info(binary_path)

        self.pdb_path = os.path.join(download_dir, pdb_path)

        if not os.path.exists(self.pdb_path):
            logger.info(f"PDB file not found: {pdb_path}")
            self.download_pdb(os.path.dirname(pdb_path))

        if os.path.exists(self.pdb_path):
            self.pdb = pdbparse.parse(self.pdb_path)
            logger.info(f"Loaded PDB file: {pdb_path}")
        else:
            logger.warning("Failed to load PDB file")

    def load_global_symbols(self) -> None:
        """
        Load global symbols from the PDB.
        """
        if not self.pdb:
            logger.warning("No PDB loaded, cannot load global symbols")
            return

        for stream in self.pdb.streams:
            if hasattr(stream, 'funcs'):
                for sym, sym_value in stream.funcs.items():
                    self.symbols[sym_value.offset] = sym_value.name
                    logger.debug(f"Global symbol: {sym_value.name} at {hex(sym_value.offset)}")

    def get_text_section_offset(self) -> None:
        """
        Get the offset of the .text section from the image base.
        """
        main_object = self.proj.loader.main_object
        for section_name, section in main_object.sections_map.items():
            if section_name.startswith('.text'):
                self.text_section_offset = section.vaddr - main_object.mapped_base
                return

        logger.warning("Could not find .text section. Using 0 as offset.")
        self.text_section_offset = 0

    @staticmethod
    def demangle_name(mangled_name: str) -> str:
        """
        Demangle a C++ function name and extract just the function name.

        Args:
            mangled_name (str): The mangled function name.

        Returns:
            str: The demangled function name without parameters or return type.
        """
        try:
            full_demangled: str = cdecl_sym(demangle(mangled_name))
            match: Optional[re.Match] = re.search(r'(?:.*::)?(\w+)\(', full_demangled)
            return match.group(1) if match else full_demangled
        except:
            return mangled_name

    def address_to_symbol(self, address: int) -> Optional[str]:
        """
        Convert an address to a symbol name.

        Args:
            address (int): The address to look up.

        Returns:
            Optional[str]: The symbol name if found, None otherwise.
        """
        rva: int = address - self.proj.loader.main_object.mapped_base

        """symbol: Optional[str] = self.symbols.get(rva)
        if symbol:
            return symbol
        """

        adjusted_rva: int = rva - self.text_section_offset
        symbol: Optional[str] = self.symbols.get(adjusted_rva)
        if symbol:
            return symbol

        logger.warning(f"Symbol not found for address {hex(address)} (RVA: {hex(rva)}, Adjusted RVA: {hex(adjusted_rva)})")
        return None

    def update_kb_with_symbols(self) -> None:
        """
        Update the knowledge base with symbols.

        This method updates the names of functions in the angr knowledge base
        with demangled symbols from the PDB.
        """
        for func in self.proj.kb.functions.values():
            symbol = self.address_to_symbol(func.addr)
            if symbol:
                demangled = self.demangle_name(symbol)
                func.name = demangled
                logger.debug(f"Function {hex(func.addr)} updated with symbol: {func.name}")

    def download_pdb(self, download_dir: str = ".") -> None:
        """
        Download the PDB file for the current binary.

        Args:
            download_dir (str): Directory to save the downloaded PDB.
        """
        pdbname, signature = self.get_pdb_info(self.proj.filename)

        if self.is_pdb_stored_locally(download_dir, pdbname):
            logger.info(f"PDB already exists locally for {self.proj.filename}")
            return

        download_url = f"https://msdl.microsoft.com/download/symbols/{pdbname}/{signature.upper()}/{pdbname}"
        logger.info(f"Downloading PDB from: {download_url}")

        r = requests.head(
            download_url,
            headers={"User-Agent": "Microsoft-Symbol-Server/10.0.10036.206"},
            allow_redirects=True
        )

        if r.status_code == 200:
            target_file = os.path.join(download_dir, pdbname)
            with requests.get(r.url, headers={"User-Agent": "Microsoft-Symbol-Server/10.0.10036.206"},
                              stream=True) as pdb:
                pdb.raise_for_status()
                with open(target_file, "wb") as f:
                    for chunk in pdb.iter_content(chunk_size=8192):
                        f.write(chunk)
            logger.info(f"PDB downloaded to: {target_file}")
            self.pdb_path = target_file
        else:
            logger.error(f"(HTTP {r.status_code}) Could not find PDB at {download_url}")

    @staticmethod
    def get_pdb_info(binary_path: str) -> Tuple[str, str]:
        """
        Extract PDB name and signature from a PE file.

        Args:
            binary_path (str): Path to the PE file.

        Returns:
            Tuple[str, str]: A tuple containing the PDB name and signature.
        """
        pe_obj = pefile.PE(binary_path, fast_load=True)
        pe_obj.parse_data_directories([pefile.DIRECTORY_ENTRY['IMAGE_DIRECTORY_ENTRY_DEBUG']])

        for debug_entry in pe_obj.DIRECTORY_ENTRY_DEBUG:
            if hasattr(debug_entry.entry, 'PdbFileName'):
                pdb_filename = debug_entry.entry.PdbFileName.decode('utf-8').rstrip('\x00')
                guid = debug_entry.entry.Signature_String

                # Use only the filename if a full path is given
                pdb_filename = os.path.basename(pdb_filename)

                return pdb_filename, guid

        raise ValueError("No PDB debug information found in the PE file")

    @staticmethod
    def is_pdb_stored_locally(directory: str, filename: str) -> bool:
        """Check if the PDB file already exists locally."""
        return os.path.exists(os.path.join(directory, filename))
And can be used like this:
symbol_manager = symbols.SymbolManager(proj) # angr.Project
symbol_manager.download_pdb()
symbol_manager.update_kb_with_symbols()
The same information displayed before now shows proper function names:
Active state: <SimState @ 0x1400010f0>
2024-06-30 13:56:35 | DEBUG | [introspection.py:113] pretty_print_callstack() | Call Stack:
  -> 0x140001200 : run_heap_operations None (0 xrefs)
    -> 0x140001550 : printf None (0 xrefs)
-> 0x140001238 : run_heap_operations None (0 xrefs)
-> 0x140001284 : run_heap_operations None (0 xrefs)
-> 0x1400012f1 : run_heap_operations None (0 xrefs)
-> 0x1400012f8 : run_heap_operations None (0 xrefs)
  -> 0x140001550 : printf None (0 xrefs)
    -> 0x140001304 : run_heap_operations None (0 xrefs)
      -> 0x140001040 : do_heap_op (long long (64 bits), long long (64 bits)) -> void (0 xrefs)
      -> 0x1400011b0 : do_heap_op (long long (64 bits), long long (64 bits)) -> void (0 xrefs)
      -> 0x1400011b9 : do_heap_op (long long (64 bits), long long (64 bits)) -> void (0 xrefs)
        -> 0x140100050 : malloc (unsigned long (64 bits)) -> void* (0 xrefs)
    -> 0x1400011c2 : do_heap_op (long long (64 bits), long long (64 bits)) -> void (0 xrefs)
-> 0x140001550 : printf None (0 xrefs)
  -> 0x1400011e5 : do_heap_op (long long (64 bits), long long (64 bits)) -> void (0 xrefs)
    -> 0x140001311 : run_heap_operations None (0 xrefs)
-> 0x140001040 : do_heap_op (long long (64 bits), long long (64 bits)) -> void (0 xrefs)
-> 0x140001056 : do_heap_op (long long (64 bits), long long (64 bits)) -> void (0 xrefs)
-> 0x140001060 : do_heap_op (long long (64 bits), long long (64 bits)) -> void (0 xrefs)
-> 0x14000106a : do_heap_op (long long (64 bits), long long (64 bits)) -> void (0 xrefs)
-> 0x1400010b9 : do_heap_op (long long (64 bits), long long (64 bits)) -> void (0 xrefs)
-> 0x1400010c5 : do_heap_op (long long (64 bits), long long (64 bits)) -> void (0 xrefs)
-> 0x1400010d9 : do_heap_op (long long (64 bits), long long (64 bits)) -> void (0 xrefs)
-> 0x1400010f0 : do_heap_op (long long (64 bits), long long (64 bits)) -> void (0 xrefs) (repeated 97 times)
Handle errored states
I made this simple helper function to print a Python backtrace:
def show_errors(state: angr.SimState) -> None:
    """
    Log error information for a given state.

    Args:
        state: The simulation state.
    """
    logger.debug(f'errored state: {state}')
    logger.debug(f'error message: {state.error}')

    tb: Any = state.traceback

    while tb.tb_next:
        logger.error(f'{tb.tb_frame}')
        tb = tb.tb_next

    logger.error(f'{tb.tb_frame}')
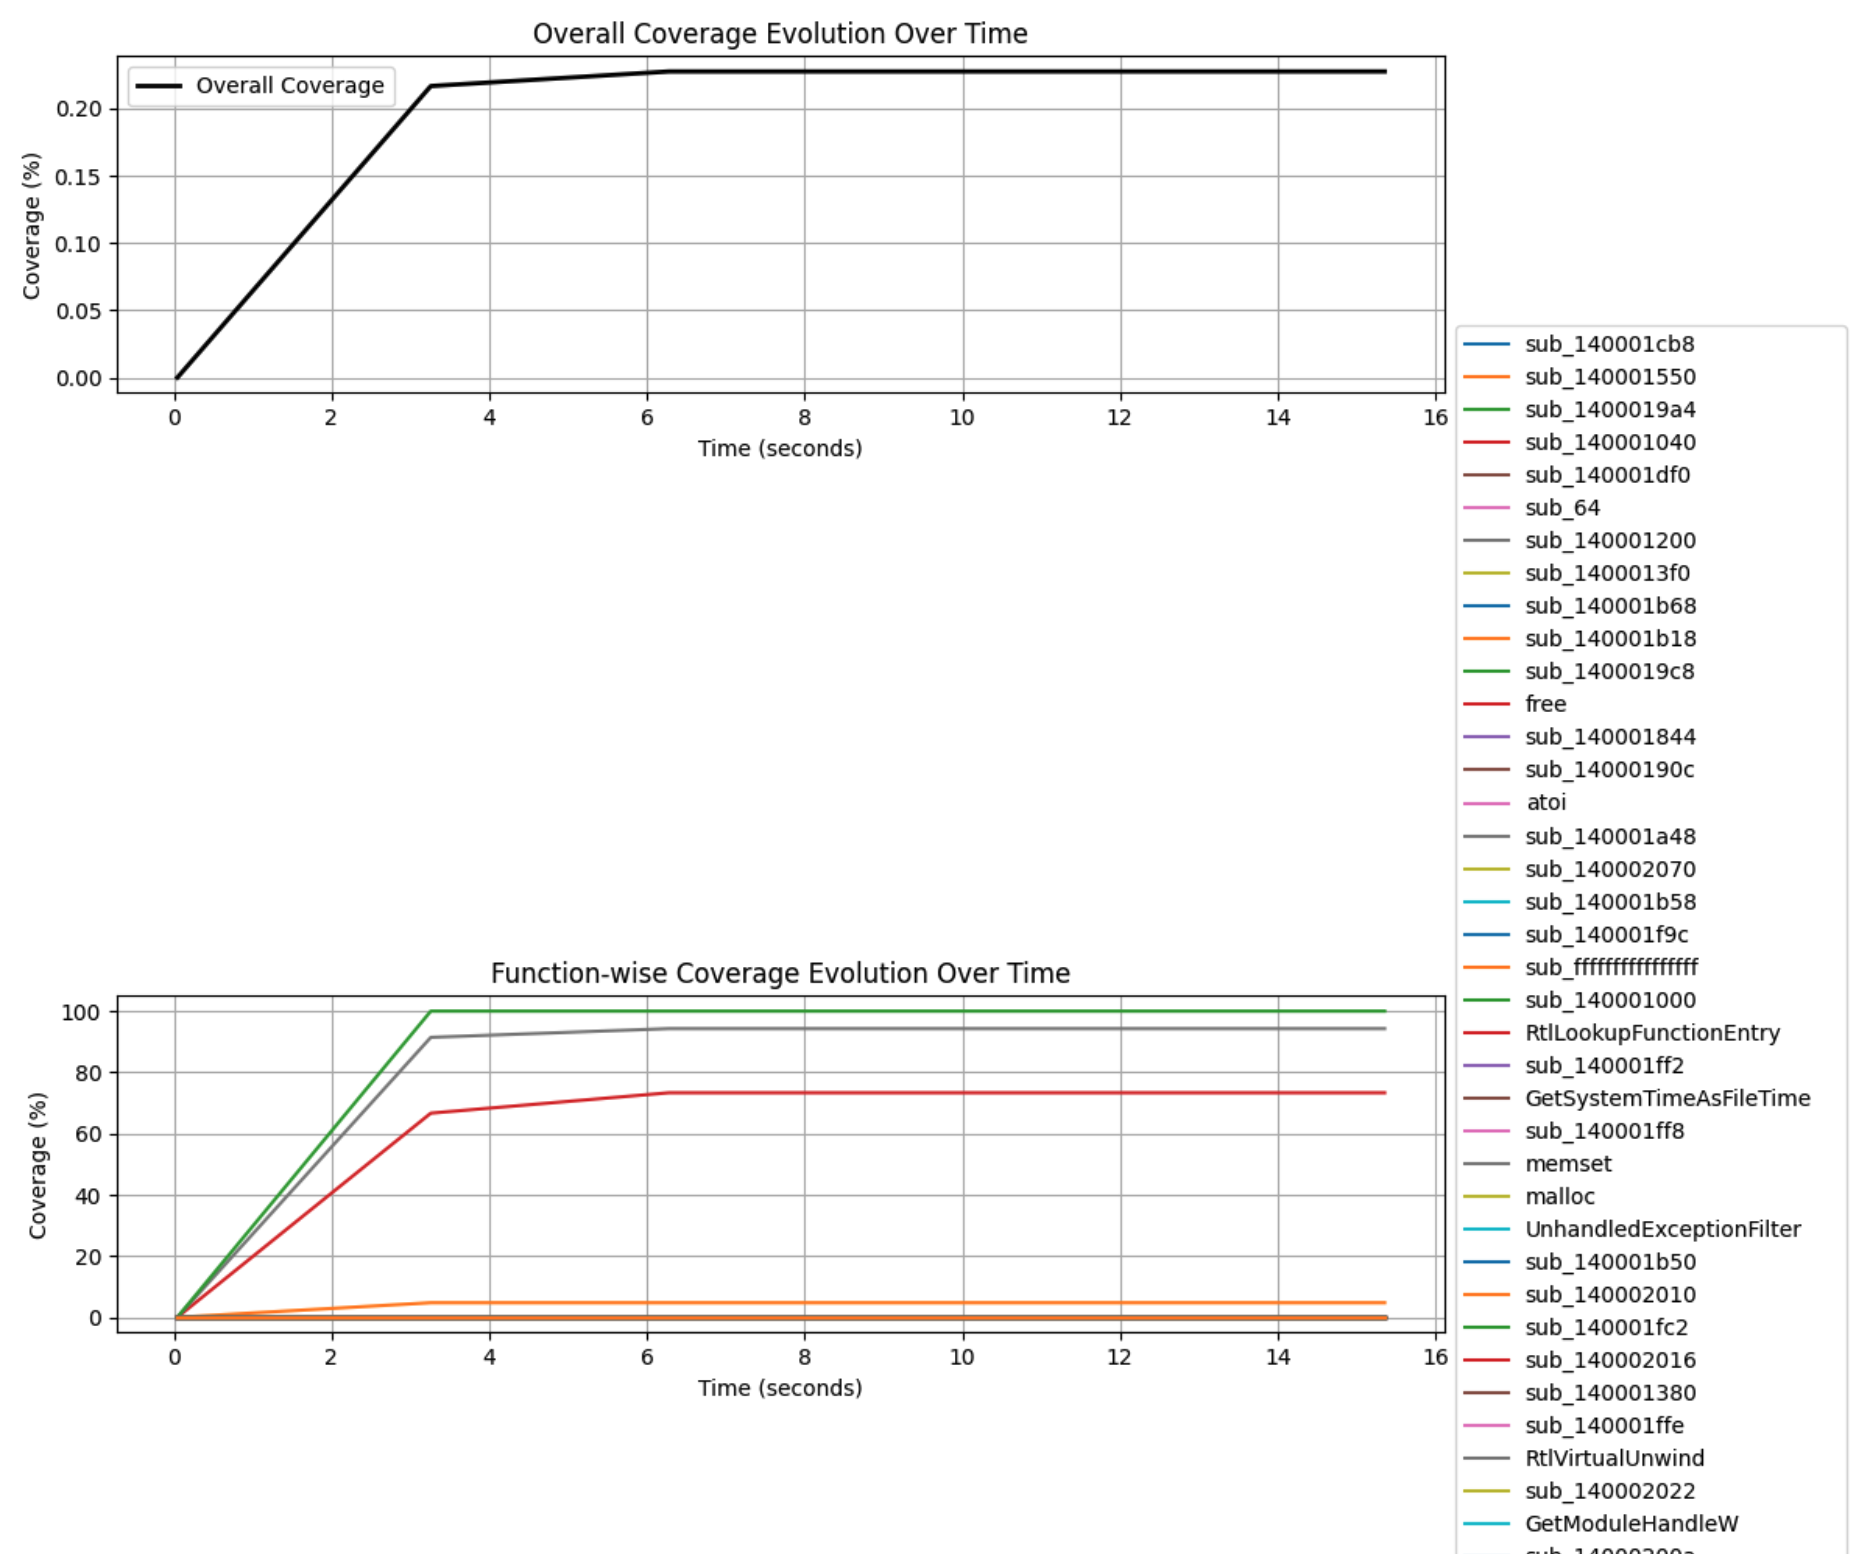
Real-time code coverage with trends
Wouldn’t it be nice to have a status update every 5 seconds, showing how many blocks were newly discovered by angr, the code coverage progress in percent for each function and a graph showing if angr is slowing down?
Demo time:
INFO     core.coverage:coverage.py:90 --- Coverage Update at 0.01 seconds ---
INFO     core.coverage:coverage.py:117 Overall coverage: 0.00% [+0 blocks total]
INFO     core.coverage:coverage.py:119 Newly discovered functions: sub_140001550, sub_140001b68, sub_140001380, sub_140002070, UnhandledExceptionFilter, QueryPerformanceCounter, free
INFO     core.coverage:coverage.py:90 --- Coverage Update at 4.10 seconds ---
INFO     core.coverage:coverage.py:112 Function: sub_140001550 - Covered blocks: 1/21 (4.76%) [+1 blocks]
INFO     core.coverage:coverage.py:112 Function: sub_140001040 - Covered blocks: 20/30 (66.67%) [+20 blocks]
INFO     core.coverage:coverage.py:112 Function: sub_140001200 - Covered blocks: 32/35 (91.43%) [+32 blocks]
INFO     core.coverage:coverage.py:112 Function: sub_140001000 - Covered blocks: 8/8 (100.00%) [+8 blocks]
INFO     core.coverage:coverage.py:117 Overall coverage: 0.22% [+61 blocks total]
INFO     core.coverage:coverage.py:90 --- Coverage Update at 7.78 seconds ---
INFO     core.coverage:coverage.py:112 Function: sub_140001040 - Covered blocks: 22/30 (73.33%) [+2 blocks]
INFO     core.coverage:coverage.py:112 Function: sub_140001200 - Covered blocks: 33/35 (94.29%) [+1 blocks]
INFO     core.coverage:coverage.py:117 Overall coverage: 0.23% [+3 blocks total]
INFO     core.coverage:coverage.py:90 --- Coverage Update at 11.07 seconds ---
INFO     core.coverage:coverage.py:117 Overall coverage: 0.23% [+0 blocks total]
INFO     core.coverage:coverage.py:90 --- Coverage Update at 14.33 seconds ---
And a visual graph:
The code is a simple class that can be plugged-in right away in your angr project:
import os
import time
import threading
from typing import Dict, List, Tuple, Set, Any
import matplotlib.pyplot as plt
import networkx as nx
from matplotlib.animation import FuncAnimation
import angr
import logging

logger = logging.getLogger(__name__)

logging.getLogger("matplotlib").setLevel(logging.ERROR)


class CoverageMonitor:
    def __init__(self, proj: angr.Project, cfg: angr.analyses.CFGEmulated, entry_point: int,
                 update_interval: float = 5.0, coverage_dir: str = "cov"):
        """
        Initialize the CoverageMonitor.

        :param proj: The Angr project
        :param cfg: The Control Flow Graph
        :param entry_point: The entry point address
        :param update_interval: The interval between updates in seconds
        """
        self.proj: angr.Project = proj
        self.cfg: angr.analyses.CFGEmulated = cfg
        self.entry_point: int = entry_point
        self.update_interval: float = update_interval
        self.coverage_data: Dict[str, List[Tuple[float, int, float]]] = {}
        self.overall_coverage_data: List[Tuple[float, float]] = []
        self.start_time: float = time.time()
        self.stop_event: threading.Event = threading.Event()
        self.previous_coverage: Dict[str, Dict[str, int]] = {}
        self.previous_total_blocks: int = 0
        self.previous_functions: Set[str] = set()
        self.coverage_dir: str = coverage_dir

    def start_monitoring(self) -> None:
        """Start the coverage monitoring thread."""

        # clear the coverage directory
        for filename in os.listdir(self.coverage_dir):
            if filename.startswith("00"):
                os.remove(os.path.join(self.coverage_dir, filename))

        self.monitoring_thread = threading.Thread(target=self._monitor_coverage)
        self.monitoring_thread.start()

    def stop_monitoring(self) -> None:
        """Stop the coverage monitoring thread."""
        self.stop_event.set()
        self.monitoring_thread.join()

    def _monitor_coverage(self) -> None:
        """Monitor the coverage and update the data periodically."""
        while not self.stop_event.is_set():
            self._update_coverage()
            self.plot_coverage()
            time.sleep(self.update_interval)

    def _analyze_coverage(self) -> Tuple[float, Dict[str, Dict[str, int]]]:
        """
        Analyze the current coverage using Angr.

        :return: A tuple containing overall coverage percentage and function-wise coverage data
        """
        overall_coverage, function_coverage = analyze_coverage(self.proj, self.cfg, self.entry_point, "cov")

        # Convert the function_coverage to the format we need
        formatted_coverage: Dict[str, Dict[str, int]] = {}
        for func_addr, data in function_coverage.items():
            func_name = self.proj.kb.functions.get(func_addr).name
            formatted_coverage[func_name] = {
                "covered_blocks": data['covered_blocks'],
                "total_blocks": data['total_blocks']
            }

        return overall_coverage, formatted_coverage

    def _update_coverage(self) -> None:
        """Update the coverage data and log the results."""
        overall_coverage, function_coverage = self._analyze_coverage()
        elapsed_time = time.time() - self.start_time

        total_blocks = 0
        new_functions = set(function_coverage.keys()) - self.previous_functions

        logger.info(f"--- Coverage Update at {elapsed_time:.2f} seconds ---")

        for func_name, data in function_coverage.items():
            if func_name not in self.coverage_data:
                self.coverage_data[func_name] = []

            covered_blocks = data['covered_blocks']
            total_blocks += covered_blocks
            total_func_blocks = data['total_blocks']
            coverage_percentage = (covered_blocks / total_func_blocks) * 100 if total_func_blocks > 0 else 0

            self.coverage_data[func_name].append((elapsed_time, covered_blocks, coverage_percentage))

            # Calculate difference from previous update
            prev_covered = self.previous_coverage.get(func_name, {}).get('covered_blocks', 0)
            block_diff = covered_blocks - prev_covered

            if block_diff > 0 or func_name in new_functions:

                if covered_blocks == 0:
                    continue

                logger.info(f"Function: {func_name} - Covered blocks: {covered_blocks}/{total_func_blocks} "
                            f"({coverage_percentage:.2f}%) [+{block_diff} blocks]")

        # Log overall statistics
        new_total_blocks = total_blocks - self.previous_total_blocks
        logger.info(f"Overall coverage: {overall_coverage:.2f}% [+{new_total_blocks} blocks total]")
        if new_functions:
            logger.info(f"Newly discovered functions: {', '.join(new_functions)}")

        # Update overall coverage data
        self.overall_coverage_data.append((elapsed_time, overall_coverage))

        # Update previous state
        self.previous_coverage = function_coverage
        self.previous_total_blocks = total_blocks
        self.previous_functions = set(function_coverage.keys())

    def plot_coverage(self) -> None:
        """Plot the coverage evolution over time."""
        fig, (ax1, ax2) = plt.subplots(2, 1, figsize=(12, 12))

        # Plot overall coverage
        times, coverages = zip(*self.overall_coverage_data)
        ax1.plot(times, coverages, label='Overall Coverage', linewidth=2, color='black')
        ax1.set_xlabel('Time (seconds)')
        ax1.set_ylabel('Coverage (%)')
        ax1.set_title('Overall Coverage Evolution Over Time')
        ax1.legend()
        ax1.grid(True)

        # Plot function-wise coverage
        for func_name, data in self.coverage_data.items():
            times, _, coverages = zip(*data)
            ax2.plot(times, coverages, label=func_name)

        ax2.set_xlabel('Time (seconds)')
        ax2.set_ylabel('Coverage (%)')
        ax2.set_title('Function-wise Coverage Evolution Over Time')
        ax2.legend(loc='center left', bbox_to_anchor=(1, 0.5))
        ax2.grid(True)

        plt.tight_layout()
        plt.show()


def monitor_coverage(proj: angr.Project, cfg: angr.analyses.CFGEmulated, entry_point: int,
                     duration: float = 10.0, update_interval: int = 5) -> None:
    """
    Monitor the coverage evolution for a specified duration.

    :param proj: The Angr project
    :param cfg: The Control Flow Graph
    :param entry_point: The entry point address
    :param duration: The duration to monitor in seconds
    :param update_interval: The interval between updates in seconds
    """
    monitor = CoverageMonitor(proj, cfg, entry_point, update_interval=update_interval)
    monitor.start_monitoring()

    try:
        time.sleep(duration)
    finally:
        monitor.stop_monitoring()
        monitor.plot_coverage()


def get_reachable_info(cfg: angr.analyses.cfg.cfg_fast.CFGBase, entry_point: int) -> Tuple[
    Set[int], Dict[int, Set[angr.knowledge_plugins.cfg.cfg_node.CFGNode]]]:
    """
    Get reachable blocks and functions from the entry point in the CFG.

    Args:
        cfg: The control flow graph.
        entry_point: The entry point address.

    Returns:
        A tuple containing reachable blocks and reachable functions.
    """
    entry_node: angr.knowledge_plugins.cfg.cfg_node.CFGNode = cfg.get_any_node(entry_point)
    if not entry_node:
        raise ValueError(f"Entry point {hex(entry_point)} not found in CFG")

    reachable_nodes: Set[angr.knowledge_plugins.cfg.cfg_node.CFGNode] = nx.descendants(cfg.graph, entry_node)
    reachable_nodes.add(entry_node)

    reachable_blocks: Set[int] = set(node.addr for node in reachable_nodes if node.block)

    reachable_functions: Dict[int, Set[angr.knowledge_plugins.cfg.cfg_node.CFGNode]] = {}
    for node in reachable_nodes:
        if node.function_address not in reachable_functions:
            reachable_functions[node.function_address] = set()
        reachable_functions[node.function_address].add(node)

    return reachable_blocks, reachable_functions


def read_coverage_files(coverage_dir: str) -> Set[int]:
    """
    Read coverage files and return a set of covered block addresses.

    Args:
        coverage_dir: The directory containing coverage files.

    Returns:
        A set of covered block addresses.
    """
    covered_blocks: Set[int] = set()
    for filename in os.listdir(coverage_dir):
        if filename.startswith("00"):
            with open(os.path.join(coverage_dir, filename), 'r') as f:
                covered_blocks.update(int(line.strip(), 16) for line in f if line.strip())
    return covered_blocks


def compare_coverage(proj: angr.Project, reachable_blocks: Set[int],
                     reachable_functions: Dict[int, Set[angr.knowledge_plugins.cfg.cfg_node.CFGNode]],
                     covered_blocks: Set[int]) -> Tuple[float, Dict[str, Dict[str, Any]]]:
    """
    Compare coverage between reachable blocks and covered blocks.

    Args:
        proj: The angr project.
        reachable_blocks: Set of reachable block addresses.
        reachable_functions: Dictionary of reachable functions and their nodes.
        covered_blocks: Set of covered block addresses.

    Returns:
        A tuple containing overall coverage and function coverage information.
    """
    total_reachable: int = len(reachable_blocks)
    total_covered: int = len(covered_blocks.intersection(reachable_blocks))
    overall_coverage: float = total_covered / total_reachable if total_reachable > 0 else 0

    function_coverage: Dict[str, Dict[str, Any]] = {}
    for func_addr, nodes in reachable_functions.items():
        func: angr.knowledge_plugins.functions.function.Function = proj.kb.functions.get(func_addr)
        if func:
            func_blocks: Set[int] = set(node.addr for node in nodes if node.block)
            covered_func_blocks: Set[int] = func_blocks.intersection(covered_blocks)
            coverage: float = len(covered_func_blocks) / len(func_blocks) if func_blocks else 0
            function_coverage[func.name] = {
                'address': func_addr,
                'total_blocks': len(func_blocks),
                'covered_blocks': len(covered_func_blocks),
                'coverage': coverage
            }

    return overall_coverage, function_coverage


def analyze_coverage(proj: angr.Project, cfg: angr.analyses.cfg.cfg_fast.CFGBase, entry_point: int,
                     coverage_dir: str, coverage_file: str = 'reachable_blocks.txt') -> Tuple[float, Dict[str, Dict[str, Any]]]:
    """
    Analyze coverage for the given project and CFG.

    Args:
        proj: The angr project.
        cfg: angr control flow graph.
        entry_point: The entry point address.
        coverage_dir: The directory containing coverage files.
        coverage_file: The coverage file to write to

    Returns:
        A tuple containing overall coverage and function coverage information.
    """
    reachable_blocks, reachable_functions = get_reachable_info(cfg, entry_point)
    covered_blocks = read_coverage_files(coverage_dir)
    overall_coverage, function_coverage = compare_coverage(proj, reachable_blocks, reachable_functions, covered_blocks)

    with open(coverage_file, 'w') as f:
        f.write("\n".join([hex(block) for block in reachable_blocks]))

    return overall_coverage, function_coverage
And used as follows:
monitor = coverage.CoverageMonitor(shared.proj, shared.cfg, self.entry_point, update_interval=3.0, coverage_dir="cov")
monitor.start_monitoring()
Conclusion
Thanks to these new tools in your toolbox, I hope you’ll get a better user experience with angr and (again) give it a chance. It really is an awesome framework!